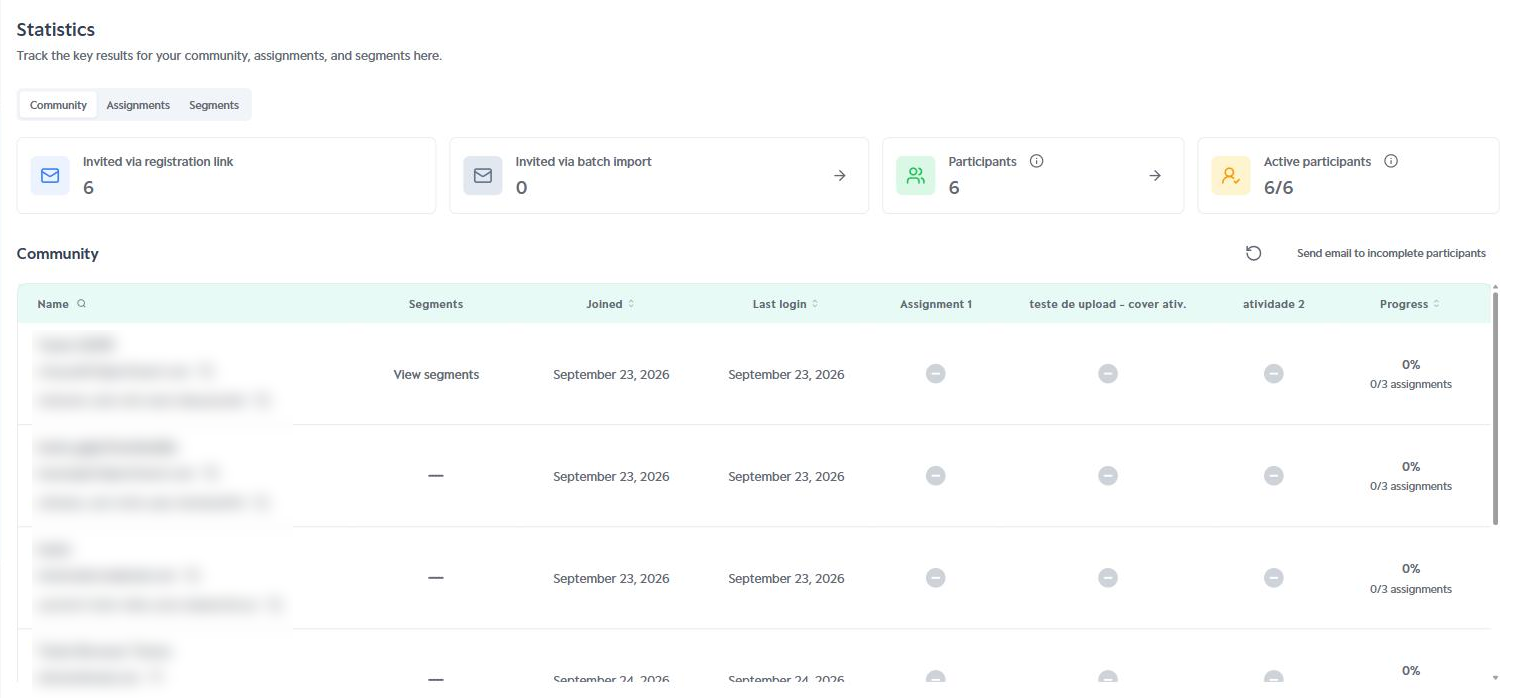
Statistics is the area of the platform where administrators, moderators and observers track the progress of the community. In this space, the main participation and completion indicators are gathered and organized by community, assignments and segments.
With it, you can quickly see who is participating, which assignments have already been completed and who has not started yet, making it easier to follow the study from beginning to end.
Think of the Statistics tab as the study's progress dashboard. While the Report is where the content of the responses is analyzed, Statistics shows who responded and how far the community has progressed.
Where to find it
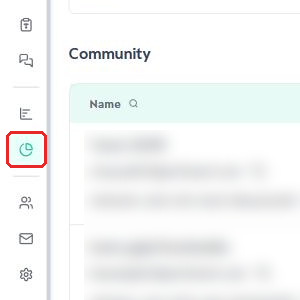
To access the Statistics screen, click the Statistics icon in the platform's sidebar.
Types of views
On the Statistics screen, the community's progress can be tracked in different ways. Each view organizes the information in a specific way:
Community: In this tab you will find an overview of the participants and the progress of each one across all assignments.
Assignments: In this tab you will find the progress of each assignment in the community, with the number of participants who completed it, have not started it or have it incomplete.
Segments: In this tab you will find the progress of participants grouped by segment.
Available actions
Refresh data: Reloads the information displayed without leaving the screen.
Send email to incomplete participants: Sends an email reminder to participants who have not started or have not completed their assignments.
Download statistics: Downloads the progress data of a specific assignment.
Important tip:
Use Statistics together with the Report: in Statistics you identify who has not responded yet and can send a reminder, and in the Report you analyze the content of the responses already submitted.
Was this article helpful?
That’s Great!
Thank you for your feedback
Sorry! We couldn't be helpful
Thank you for your feedback
Feedback sent
We appreciate your effort and will try to fix the article